Introduction to the TissUUmaps interactive viewer
To give this resource the best user experience, we made it possible to access all the processed data available in a browsable manner. When accessing https://hdcaheart.serve.scilifelab.se/web/index.html, three columns are visible, one for each of our modalities: ISS, Visium, and Single-cell.
On the ISS, you can access the cell type probabilities individually, the class names or the gene markers expression onto the 9 sections. The same is visible on either the raw data (Unfiltered pciseq) and for filtered bad quality cells (Filtered pciseq 05).
On the Visium, you can access the 38 sections (All sections), the UMAP performed with the subset of 17 sections (UMAP Feature Space) and the sections and the UMAP next to each other (UMAP + Spatial next to each other).
You can embed the sections and the UMAP with some metadata, quality metrics and processed data. When selecting NMF, you can embed the sections with a factor and corresponding top30 feature loadings. You can also access the deconvolution results, calculated with the coarse-grained clusters (HL) with all the cells (High Level Deconvolution), calculated with the coarse-grained clusters (HL) in a age-specific manner, or calculated with the fine-grained clusters (DL) with all the cells.
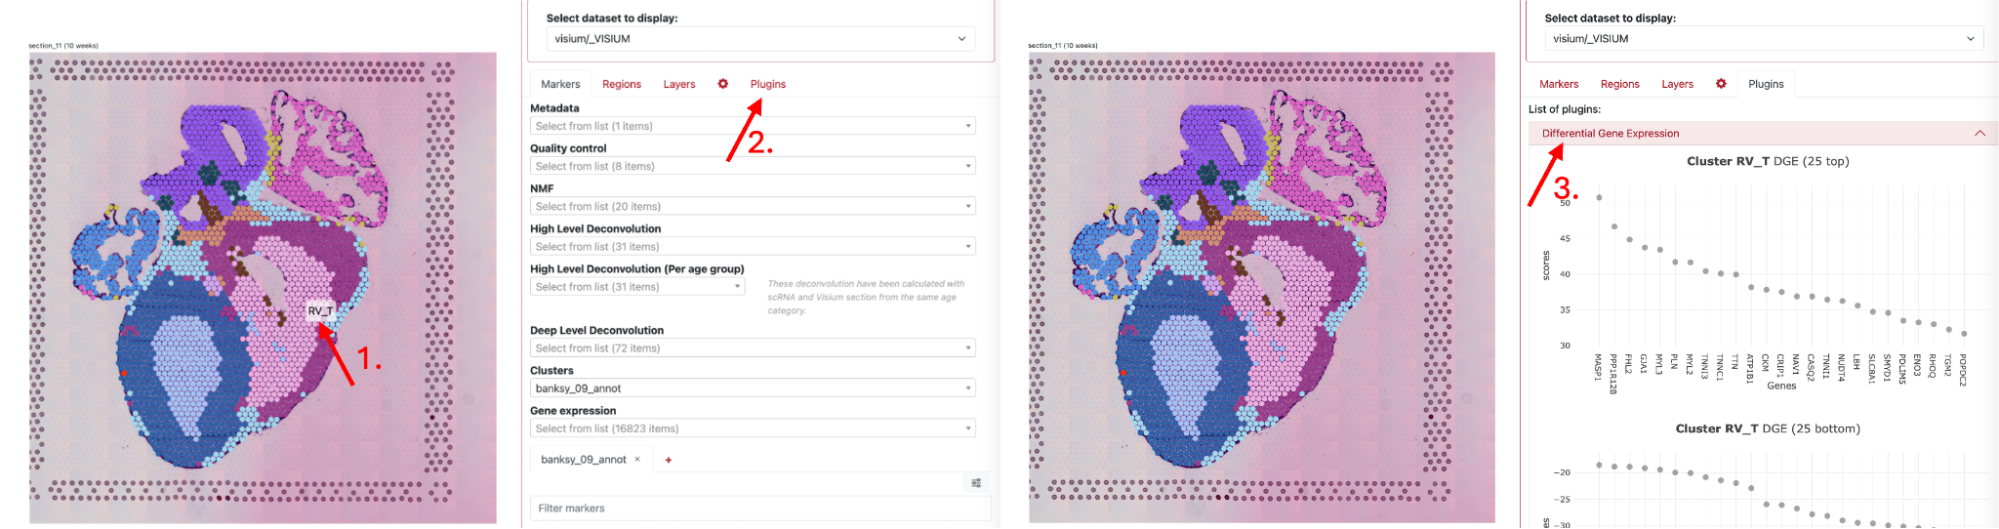
Under Clusters, you can display either the ST clusters (seurat_clusters_annot) or the regions (banksy_09_annot). If you click on a spot from a cluster (1.) (name should be visible, like in figure below), you can then access the “plugins” section (2.) and display genes differentially expressed in that cluster/region (3.).
Additionally, all the genes can be plotted onto the sections.
Specifically, on the Feature space page, in addition to the annotated clusters, the UMAP can be embedded with multiple numerical observations (age, nCount, nFeature, sample_id).
Specifically to the UMAP + Spatial page, the UMAP can be embedded with every layer present in the All sections.
On the single-cell data, the coarse-grained clustering and the 4 fine-grained clusterings can be accessed individually. On each of those layers, various metadate and quality metrics can be plotted. For the clusters, the same plugin as for Visium is available, clicking a cell from a cluster (1.), selecting the plugins (2.), and displaying the differential gene expression (3.). The UMAP for the 5 single-cell layers can be embedded with the gene expression as well.
Disclaimer: The ISS panel used in our study was not designed to reflect the molecular heterogeneity of the accompanying single-cell RNA-sequencing dataset, and the overall low signal density further hinders high-confidence cell type identification. Consequently, different cell types present diverse assignment probabilities due to imbalances in the used gene panel. Therefore, probabilistic cell type mapping results presented in the ISS section do not reflect the proportions between the analyzed coarse-grained cell states within the heart tissue.